Home » Restaurant P&L Statement: Structure, Benchmarks, and What Late Books Cost You
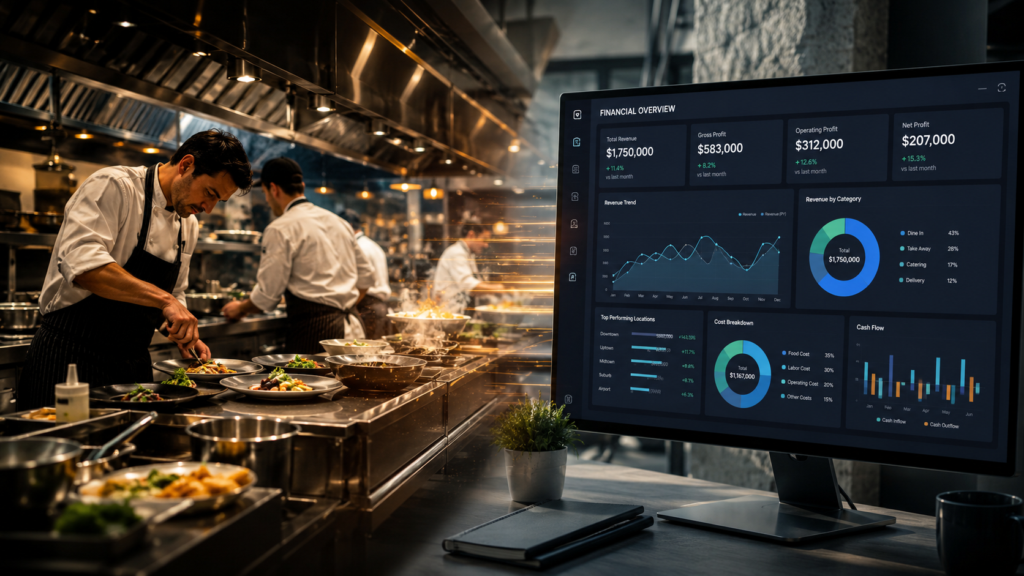
A restaurant P&L statement should close within 5 to 10 business days of period end – not 15, not 30. Every day your books stay open after day 10 is a day you’re making labor, inventory, and staffing decisions without real financial data. For a 10-unit restaurant group, that delay can silently cost $15,000 to $40,000 per period in undetected variance, over-ordering, and labor overruns that a faster close would have caught and corrected.
This article is written for multi-unit restaurant operators, franchise group CFOs, and finance leaders managing 5 to 500+ locations. It covers what a properly structured restaurant P&L looks like, how period-end close timing directly impacts profitability, and what you can benchmark your current setup against. If you’re closing late, flying blind between periods, or unsure whether your P&L is actually structured to run a restaurant – this is for you.
What Is a Restaurant P&L Statement?
A restaurant profit and loss statement – also called a restaurant income statement – is a financial report that captures all revenue and expenses for a specific operating period, organized to reveal the metrics that actually drive restaurant profitability.
Unlike a standard small business P&L, a restaurant P&L is built around operational layers: sales by category, cost of goods sold (COGS), prime cost, controllable expenses, and occupancy costs. Each layer answers a different operational question. Together they tell you whether you made money, where you lost it, and what to do about it next period.
Check out this quick video breakdown to see how these numbers interact:
Key entities defined:
Prime cost is the sum of total food and beverage costs plus total labor costs, including taxes, benefits, and insurance. It is the most important line on a restaurant P&L. Industry benchmark for a healthy prime cost is 55–65% of total sales. Above 68% is a warning signal.
COGS (cost of goods sold) in a restaurant context includes all food, beverage, and paper goods consumed during the period. It is calculated as beginning inventory plus purchases minus ending inventory. Errors in inventory counting directly distort COGS and make the P&L unreliable.
The 13-period calendar is the accounting structure used by most multi-unit restaurant operators instead of the standard 12-month calendar. Each period covers exactly 4 weeks (28 days), producing 13 equal, directly comparable periods per year. This eliminates the distortion caused by months with different numbers of days, weekends, and holiday distributions – which materially skews same-store-sales comparisons on a monthly calendar.
A restaurant P&L built for operational management – not just tax compliance – follows a specific structure that allows operators to identify problems at the line level, not just the summary level.
Standard restaurant P&L structure:
Section | What It Captures | Key Metric |
Net Sales | Food, beverage, catering, delivery by category | Total revenue baseline |
Cost of Goods Sold | Food cost, beverage cost, paper/packaging | Food cost % (target: 28–35%) |
Gross Profit | Net Sales minus COGS | Gross margin |
Labor Costs | Hourly, salaried, management, taxes, benefits | Labor cost % (target: 25–35%) |
Prime Cost | COGS + Total Labor | Prime cost % (target: 55–65%) |
Controllable Expenses | Supplies, repairs, marketing, credit card fees | Controllable profit |
Occupancy Costs | Rent, CAM, property tax, insurance | Occupancy % (target: 6–10%) |
Restaurant Operating Profit | Revenue minus all above | EBITDA precursor |
G&A and Below-the-Line | Corporate overhead, depreciation, interest | Net profit |
Most restaurant operators who come to GSS with a bookkeeping problem, actually have a structure problem. Their P&L is organized for their accountant, not for their operations team. When a GM can’t read the P&L, the P&L isn’t doing its job.
You should receive a preliminary P&L within 5 to 7 business days of period end. A final, audited period-end package – including variance commentary and a flash report comparison – should follow within 10 business days.
If you’re receiving your P&L after day 15, you are operating reactively. You are making staffing, ordering, and menu decisions based on data that is already 3 to 5 weeks old by the time you read it.
Industry close time benchmarks:
Close Timeline | What It Signals |
Day 1–5 | Best-in-class. Fully automated AP, daily POS reconciliation, real-time inventory. |
Day 5–7 | Strong. Close is predictable and reliable. GSS standard close target. |
Day 8–14 | Acceptable but improvable. Manual steps are creating lag. |
Day 15–21 | Below standard. Likely missing automation or reconciliation process. |
Day 22–30 | Problematic. Decisions are being made blind for most of the next period. |
30+ days | Critical. Back office is a liability, not a management tool. |

Late books are not just an accounting inconvenience. They are an operational tax that compounds every period.
Here is what the financial impact looks like across the most common problem areas:
If your food cost is running 2% high and you don’t find out until day 22, you have already wasted 3 weeks of correction time. For a group doing $500,000 in revenue per period, that 2% overrun costs you $10,000 per period (or $130,000 annually) in lost margin that a faster close would have caught. Check out the National Restaurant Association’s State of the Industry Report for more on how these tight margins impact the industry as a whole.
Labor is managed in real time but measured in periods. If your P&L arrives on day 25, your managers have already scheduled and executed 3.5 more weeks of labor without knowing they were over. For a 10-unit group running $100,000 in weekly labor, a 1% overrun that goes undetected for 3 extra weeks costs $30,000 in recoverable variance. Wage pressure compounds the problem: BLS data on the food services and drinking places industry shows compensation costs have kept climbing, so an undetected labor overrun today is more expensive than it would have been last year.
Most operators place their primary vendor orders mid-period. If the previous period’s COGS hasn’t closed, those orders are based on feel, habit, or last-period memory – not data. Pairing historical COGS data with accurate forecasting for food and beverage sales ensures you order precisely what your expected revenue demands. Over-ordering by 3–5% across a 10-unit group costs $15,000 to $25,000 per period in excess inventory that either spoils or sits.
For PE-backed restaurant groups or franchise operators with lender covenants, late financials have compliance implications. Lenders typically require monthly or period-end financials within 20 to 30 days of period close. A back office that consistently closes at day 25 puts you perpetually at the edge of compliance – or over it.
Not every accounting setup delivers the same close speed, reporting quality, or operational insight. Here is an objective comparison of the three most common options for multi-unit restaurant groups.
Criteria | Local CPA Firm | Offshore BPO | Outsourced Restaurant Accounting (GSS) |
Monthly cost (10-unit group) | $12,000–$25,000 | $3,000–$6,000 | $3,000–$10,000 |
Restaurant-specific expertise | Inconsistent | Rarely | Always |
Period-end close speed | 15–30 days | 15–20 days | 5–7 days |
U.S. time zone | Yes | No | Yes |
Prime cost tracking | Rarely included | Rarely included | Standard |
Flash reporting | Not standard | Not standard | Standard |
Scales past 20 units | Painful | With quality loss | Designed for it |
Lender-ready financials | Possible | Inconsistent | Standard |
A local CPA is generalist and expensive. An offshore BPO saves money but introduces massive communication and quality risks. Choosing the right outsourced accounting partner gives you a team specialized in hospitality that hits your timelines without breaking the bank.

A restaurant P&L contains dozens of line items. But five numbers tell you 80% of what you need to know about how a period performed.
Total COGS plus total labor, divided by net sales. Target: 55–65%. Anything above 68% requires immediate investigation.
Total food and beverage COGS divided by food and beverage sales. Target: 28–35%. Variance of more than 1.5% from target warrants a line-level review.
Total labor – including taxes and benefits – divided by net sales. Target: 25–35%. Compare against your scheduling forecast for the period.
Net sales minus prime cost minus controllable expenses. This is the number your GMs should be held accountable to. It isolates what they can actually influence.
Total net sales divided by total labor hours worked. This is the efficiency metric that connects your top line to your labor line. Industry benchmarks vary by concept, but declining SPLH is a leading indicator of staffing or scheduling problems.
Below is a simplified sample restaurant profit and loss statement for a single-unit QSR concept running approximately $150,000 in weekly sales on a 4-week period.
Line Item | Amount | % of Net Sales |
Net Sales | $600,000 | 100.0% |
Food & Beverage COGS | $174,000 | 29.0% |
Gross Profit | $426,000 | 71.0% |
Total Labor (incl. taxes/benefits) | $192,000 | 32.0% |
Prime Cost | $366,000 | 61.0% |
Supplies & smallwares | $9,000 | 1.5% |
Repairs & maintenance | $6,000 | 1.0% |
Credit card & delivery fees | $18,000 | 3.0% |
Marketing | $6,000 | 1.0% |
Utilities | $12,000 | 2.0% |
Total Controllable Expenses | $51,000 | 8.5% |
Controllable Profit | $183,000 | 30.5% |
Rent & occupancy | $48,000 | 8.0% |
Restaurant Operating Profit | $135,000 | 22.5% |
G&A allocation | $18,000 | 3.0% |
Net Profit Before Tax | $117,000 | 19.5% |
This sample restaurant P&L uses a 4-week period structure and accrual accounting methodology – the standard for multi-unit operators.
Download the 4-week period Restaurant Profit and Loss (P&L) Template to see exactly where your prime cost and controllable margins stand.

A restaurant profit and loss statement – also called a restaurant income statement – is a period-end financial report that summarises all revenue and expenses for a restaurant or restaurant group. It is structured around restaurant-specific cost categories including food cost, labor cost, prime cost, and controllable expenses. Unlike a generic business P&L, a restaurant income statement uses 4-week periods rather than calendar months to ensure comparable operating periods across the year.
Multi-unit restaurant operators should produce a P&L every 4-week period – 13 times per year – rather than monthly. This 13-period calendar produces equal, directly comparable periods that eliminate the distortion caused by months with different numbers of days and weekend distributions. Some operators also produce a weekly flash report as a lighter, real-time view between full period closes.
A healthy prime cost percentage for a full-service restaurant is 55–60% of net sales. For QSR and fast-casual concepts with lower labor intensity, 55% or below is achievable. A prime cost above 65–68% typically signals either a food cost problem, a labor cost problem, or both – and requires immediate line-level investigation rather than a summary-level response.
A restaurant P&L should close within 5 to 10 business days of period end. Closing in under 5 days is achievable with full AP automation, daily POS reconciliation, and real-time inventory integration. Closes that take longer than 15 days typically indicate manual reconciliation steps, disconnected systems, or insufficient accounting resources – all of which introduce lag that costs operators real money in undetected variance.
They are the same document. “Profit and loss statement,” “income statement,” and “P&L” are interchangeable terms for the same financial report. In restaurant finance, “P&L” is the more common operational term. “Income statement” is more commonly used in formal financial reporting, audits, and lender packages. The structure and content are identical.